This is not an entirely new project, more of an expansion of the AWS Area Eligibility API
project. As I was updating the data for that project the idea to add more features came to
mind. In this case I wanted to try and add visualizations to the page to help make it more
user friendly.
The visuals come in the form of a map build using Leaflet.JS. I have had a fair amount of
experience with this form using it with the R package but not much with coding it by hand.
So it was a bit of a learning experience.
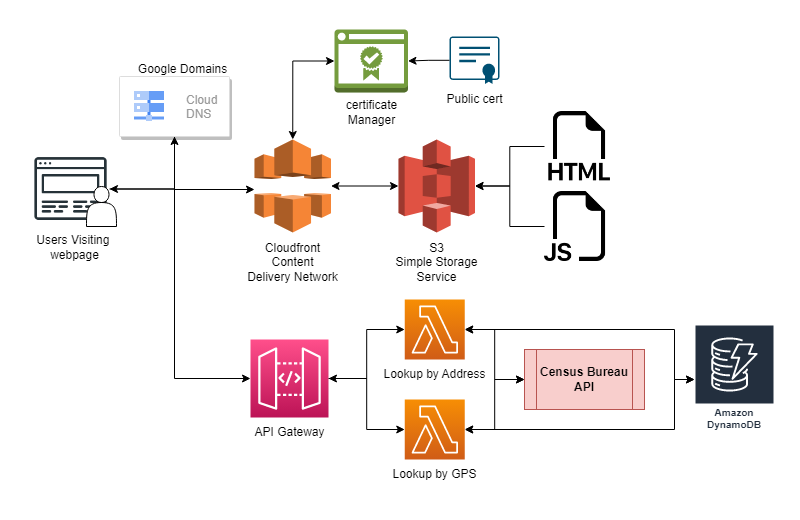
When users enter an address and it is matched with the Census bureau geocoding address file.
The lambda functions were updated to extract the GPS coordinates from that reply and serve
them with the response.
Similarly the data that was loaded into the DynamoDB table was extended to include census
block groups (eligibility areas) in the form of JSON objects. Though finding what format to
convert them to how to load them into the DB was a cause of several headaches.
In the end along with location pins outlines of eligibility areas and any areas used in
calculation eligibility are displayed to users when an address match is found.
Peeling away abstraction can feel like you are relearning something that you already know but also have never seen before.
Cannot use bulk import from S3
Typically to load the database I had been adding a nationwide CSV to S3 and running a bulk import job. This method lowers cost and was fairly simple to implement by having my code generate a CSV of each eligibility area and important details. However the JSON formatting for adding geometry was not well received by the AWS file parser. The result was building an iterative record uploader in python with the SDK
Size matters
In DynamoDB there is a limit on record size. You can store up to 400kb in a "row" or partition. When I was simply storing indexes and a few columns of numeric data this was not an issue. However, the USDA dataset uses high resolution block group shapes that can quickly fill the 400kb limit, especially when storing multiple polygons per record (in the case of calculated eligibility). This required dropping some shapes down to lower resolution models specifically made for map displays.
CloudFront Cache
As with all content delivery networks when you make updates to your webpage it can take time to propagate out to the edge network. Cloudfront does kindly add an option to invalidate cache objects that can be set with filters. But this also taught me it is helpful to incorporate a version tag as a comment in your static pages. If you are not changing visuals and simply updating things like the Javascript embedded in the page, the version number can help you identify if you are being served the latest version for testing.
Retrospective
This took a little time to figure out. There was a lot of scratching my head as I got vague errors about ingestion failures. There was a lot of reading documentation on supported file types and subsequent data types. I still believe it should be possible to upload the data in a DynamoJSON or AmazonIon file, I just did not have success in converting my data to those formats and getting them to upload to a table.
The size limit was also something I had not expected to become an issue. However in many states where there are block groups that cover large areas die to low population, the resolution of the shapes used for analysis can overwhelm the size limits. I had considered changing the storage method for the geometry, but I was hoping to avoid major adjustment to architecture.
If there is ever a need specifically to store and serve high resolution files it might be best to reference to other DB entries and pay for the additional read units. Otherwise it may be beneficial to use the lambda functions to generate signed URLs that would allow the JS to pull JSON files from S3 or else read them in lambda and push the JSON as a string back to the javascript.
Perhaps the next version of this will lead to some architectural changes.